Monitoring Key Performance Indicators for fact-based business decision making


Share


Must-know information about data analytics, data stacks and business value realization for a decision-maker.
In our day-to-day life, we monitor a lot of indicators about physical health, financial health, mental health, and more. Similarly, there is a multitude of indicators that aid enterprises in understanding their current and target business operation states. If you are in the journey of capturing these KPIs, you need to know the data sources and software ecosystem that render the error-free, information-rich, actionable KPIs from the available data. This exercise of KPIs building is more of a data analysis, which is like baking.
- Well curated and good quality ingredients or “data” for expected results (or outcome)
- The proportional blending of various ingredients or “math applied on the data” gives the best bake (information-rich KPIs)
- Appropriate tools or “data infrastructure” makes the baking process easier
- “Baking Skill” cannot be replaced with the best ingredients and bakery equipment – “the human intellect advantage”

Using unclean ingredients for the baking makes the pastry unconsumable, similarly, the unclean data need to be processed appropriately before bringing to the baker’s table. The ingredient quantity and the oven temperature bring out the crispy cookies, similarly when the math well applied to the data brings the error-free and acceptable KPIs.
Using unclean ingredients for the baking makes the pastry unconsumable, similarly, the unclean data need to be processed appropriately before bringing to the baker’s table. The ingredient quantity and the oven temperature bring out the crispy cookies, similarly when the math well applied to the data brings the error-free and acceptable KPIs.
Good data infrastructure coupled with competent data analysis brings the dependable KPIs for making your business data-driven.
Let us discuss about data stack and data definition,
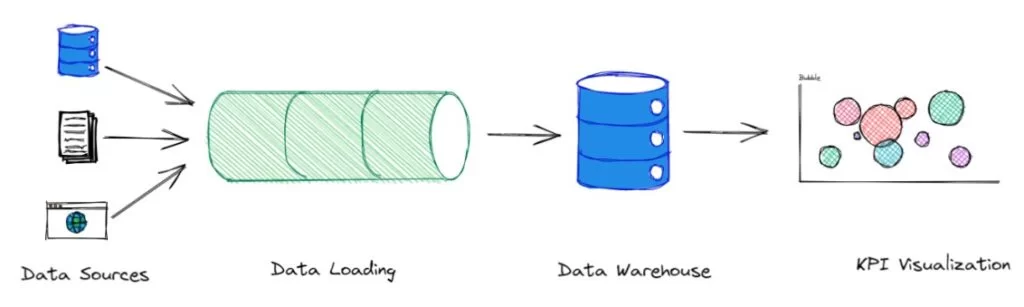
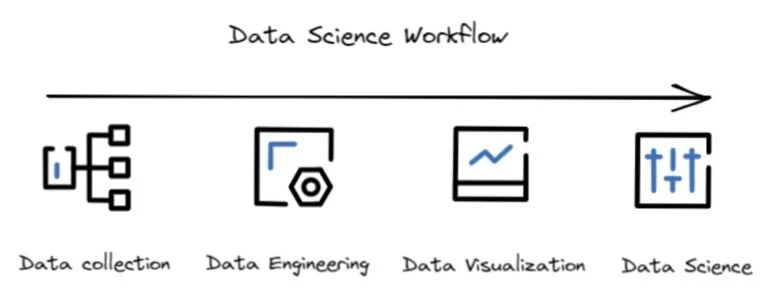
Data Stack: Data stack is a set of software units that helps to move the data from different data sources (from SAP, CRM, HRMS, Financial Systems, etc), loads into a new unified destination, clean the data, and set it ready for data visualization (for business users) and consumption of data scientists (for advanced use cases). You can learn more details here.
Data Definition: Data definition is simply defined as how various data points (variables) are arithmetically processed to get a final value that helps in making a business decision. Let me demonstrate this with an example.
In the below data set, the sales of outlets are captured, the product visibility in the storefront enables easy access of the product and more sales eventually. But some necessary items such as fruits and vegetables though moved to less visible areas also generates enough sales. If you create a new KPI concerning product placement/visibility in a Type I supermarket in Tier 1 location, that will help the sales acceleration. This needs more questions to be answered about the product attributes, day of sale, and current product visibility.
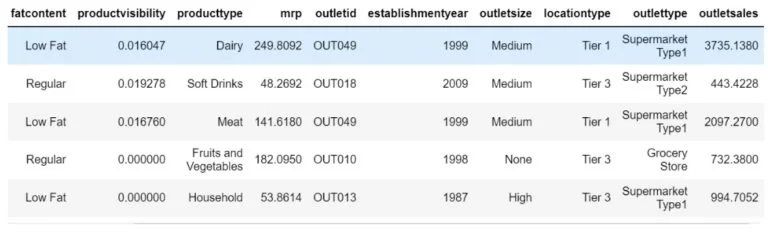
In the below data set, the sales of outlets are captured, the product visibility in the storefront enables easy access of the product and more sales eventually. But some necessary items such as fruits and vegetables though moved to less visible areas also generates enough sales. If you create a new KPI concerning product placement/visibility in a Type I supermarket in Tier 1 location, that will help the sales acceleration. This needs more questions to be answered about the product attributes, day of sale, and current product visibility.
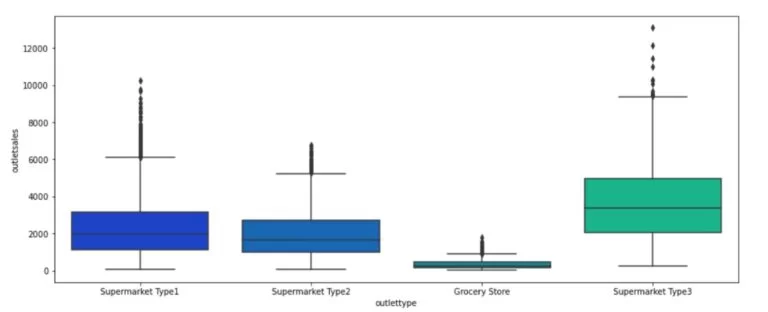
A statistical and mathematical calculation that renders the new KPI for the business users in an error-free and recurrent decision making of product placement in various cities in different types of supermarkets is termed as data definition (some practitioners term this as data augmentation or concoction).
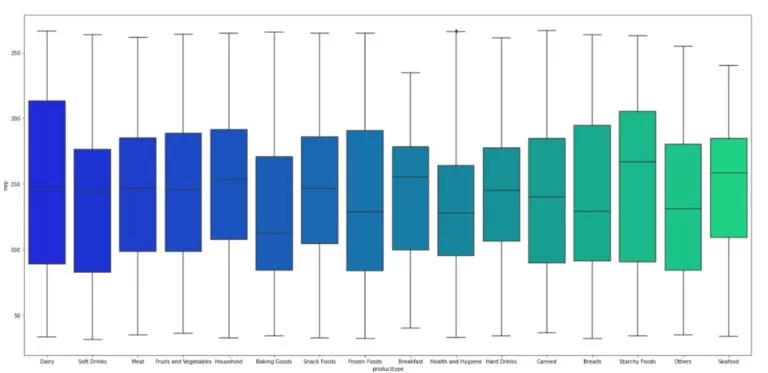
A statistical and mathematical calculation that renders the new KPI for the business users in an error-free and recurrent decision making of product placement in various cities in different types of supermarkets is termed as data definition (some practitioners term this as data augmentation or concoction).
What to consider as a decision-maker?
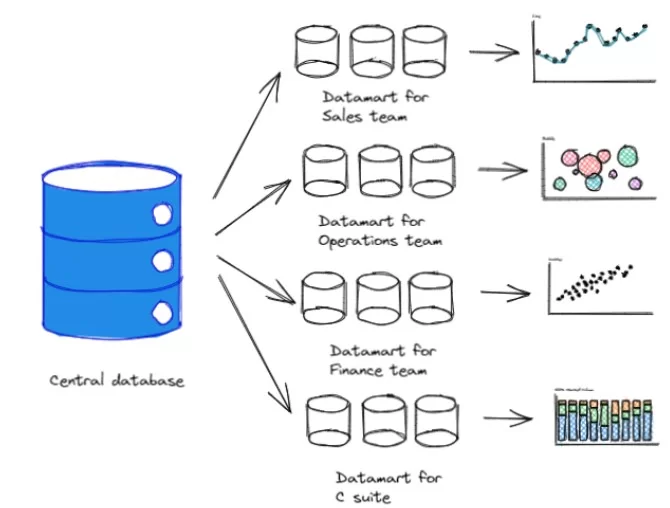
Your company should set up its infrastructure with a central database that harbours the data for analysis (by your business users and data scientists) and reporting.
This paves the path to the data-driven business. Yes, you have a single version of data that gives the necessary information for your business operation. These data need to be cleaned and packed in different boxes that can be accessed by different groups.
Ok, but where to begin?
The first and foremost is the C-suite support. This goes without saying.
What could be the potential use case in your industry? In most setting the best one to start is with business intelligence projects rather than a data science project.
After deciding the use cases, you need to work out the data stack (or data infrastructure). Then who will handle the data and the governance of the data within your organization. This potentially answers the questions:
- Who is the data owner?
- Who has the privilege to access what type of data?
Your data infrastructure decision is very much dependent on the type of data you have (structured/unstructured) and the use cases that you have decided to work on.
Few more things to consider:
- Vendor dependence: Ensure in any case that you are not dependant on vendors. When your data volume increases and the data consumers grow up the cost will escalate substantially. Be wise while stitching a contract with your vendor.
- Automation: Automation is helpful. Play this with caution. Test the system thoroughly before the deployment.
- Data Science: Don’t venture into data science projects initially. Start with KPIs or BI visualization projects. Data Science projects require skilled stakeholders to develop, implement and deploy. This also has a longer development lifecycle that includes model performance monitoring and model versioning.
- Adoption: If you already have a BI tool that the team is comfortable using, build your data presentation layer on it.
The general layout of the BI project is as follows:
Data Loading:
Data loading is the process of moving the data from the source systems such as ERP, CRM, HRMS, other third-party applications to the data warehouse. Here we have two options for data loading:
- Make: We use schedulers to schedule the load jobs and write custom code to connect with the sources. DataTheta prefers Apache Airflow, an open-source tool as a scheduler to execute code written in Python.
- Buy: The services such as Fivetran, Matillion, Stitch. These are saas products with competitive pricing.
So, how to choose between these options:
- Do you have large amounts of data? Or What is your next one-year projection?
- Do you want to have the data in your own data centre due to its trade/regulatory confidentiality?
- Do you have machines (PLC, DCS, SCADA) as your data source?
If your answer is “yes” for any one of the above, then you need to go with the “make” decision. If you have any other situation than the above quoted, write to DataTheta to obtain our opinion.
Should I build my data engineering team?
There are multiple factors you need to consider:
Speed to data consumption: How fast your team wants to consume the data. If you have ample time in hand, then plan for your first data engineer hire. If you are moving now new to the business intelligence space it is advisable to outsource the data engineering work as the workload will be less than 3 weeks for the initial projects.
Skill Availability: The skill availability is less due to the skyrocketing demand in the market. When I am drafting this article, the count of job openings is 14,000+ in India and high in other markets too.
Cost: The cost of hiring 3+ years of experience data engineer will cost around 80kEU to 110kEU per annum in Europe and 110K USD per annum in the US. Moreover, the workload will be more at the initial days of the project. Hence outsourcing makes perfect sense in most cases.
Cost: The cost of hiring 3+ years of experience data engineer will cost around 80kEU to 110kEU per annum in Europe and 110K USD per annum in the US. Moreover, the workload will be more at the initial days of the project. Hence outsourcing makes perfect sense in most cases.
Data Storage:
What is the amount of data your business will aggregate in the next year? The expected volume of data is the deciding factor for the selection of a database.
There are regular databases and massively parallel processing (MPP) databases.
If your data table does not exceed 5 – 8 million records, then you may opt for a regular SQL database. We recommend PostgreSQL for various reasons. If your business stores more data then you may consider Snowflake, Redshift, or BigQuery. If you have multiple petabytes of data, you need to consider the Data Lake architecture. Is this word new to you? Read more about Data Lake here.
Data Transformation:
After the data arrives in the central database, it is imperative to break it into clean, small, useful chunks and harbor it in different tables. This process is called data transformation and aggregation. There is a multitude of tools available to do this job.
![]()
Datatheta uses Pentaho for the data transformation jobs. Dbt is another tool worth the mention. It is an open-source tool and reduces the repetitive jobs of a data engineer. The CRUD procedure automation and keeping tab of the table lineage are useful features apart from the data testing and version control.
Data Visualization:
Data visualization is the critical component of a BI project. Mere visual appeal is not the game decider. Instead, the following need to be considered:
- Cost
- How much it can support customization for report consumers?
- Ease of use
- Handle extended size tables

At DataTheta, we tried Power BI, Tableau, Metabase, and Highcharts.
Metabase is an open-source tool. If you have less than 50 users to access the dashboard and the users know about reading the information content from data, then this is for you. If Metabase is hosted in your server then it is free to use, yet powerful.
If you are a bigger organization with more than 100 end users and require centralized control of the dashboard, then Power BI is the best option. The other tools such as Tableau and Qlik are also good to explore.
We tried Highcharts, this comes in a perpetual license model. If you have an internal team to handle the BI, this is a low-cost alternative to the Power BI and Tableau.
Cloud Service Provider:
The cloud service provider plays an important role in your business intelligence journey. If you prefer to stick to an on-premise data centre, you need to rethink the decision. Cloud services are useful and efficient in various aspects.

AWS, Azure, and Google Cloud are the market leaders in this space. If you are already utilizing the service of any of these providers, consider building the data stacks with them. You may negotiate a better deal based on your existing relationship. This article has covered the subject comprehensively.
It is important to know how the entire data ecosystem works. More important is deriving business value from data-driven decision-making. Data literacy is the important outcome of these efforts. This can be achieved by:
- Cherry-pick the best use case that suits your business.
- Understand the information content present in your data. Then, connect all the necessary data sources to a single database.
- Choose and set up the data stack suitable for your use case and organization culture. If you are not sure, it is helpful to talk to people who have done that.
This is an ever-growing field, and the technology evolves faster, so allow the right people to support your data analytics journey.
This article is created to give an overall picture of the data analytics stacks. If you are interested in our analytics service and skills-as-a-service reach out to us. You are welcome to write your comments and queries.
Images Credit: Freepik.com and Excalidraw.com
Ready to get started?
From global engineering and IT departments to solo data analysts, DataTheta has solutions for every team.