Optimizing Power BI Performance: Unleashing the Full Potential of Your Reports


Share


Power BI stands as a robust tool for transforming raw data into actionable insights. However, as reports and dashboards become more intricate, optimizing performance becomes paramount. Slow-loading reports and sluggish interactions can hinder user experience, diminishing the impact of your data-driven decisions. In this post, we will explore key strategies to optimize Power BI performance, ensuring a seamless and responsive user experience.
1.Streamlined Data Modeling
The foundation of every Power BI report is its data model. A well-designed data model not only improves report performance but also enhances overall usability. Here are some tips for efficient data modeling:
- Simplify Relationships:
Ensure that relationships between tables are necessary and optimized. Remove unnecessary relationships and use bi-directional filtering judiciously.
- Optimal Data Types:
Choose the appropriate data types for your columns to minimize storage requirements and enhance query performance. Avoid unnecessary data conversions.
- Leverage Aggregations and Summary Tables:
Pre-calculate and store summarized data using aggregations and summary tables. This reduces the load on the system during report rendering.
2.Power Query Optimization
Power Query is a potent tool for data transformation, but inefficient queries can slow down the entire data refresh process. Consider these optimizations:
- Early Data Filtering:
Apply filters as early as possible in Power Query transformations to reduce the data loaded into Power BI.
- Column Limitation:
Import only the columns you need. Eliminate unnecessary columns during the Power Query stage to minimize the data transferred to Power BI.
- Harness Query Folding:
Utilize query folding to push some transformations back to the data source, reducing the amount of data brought into Power BI for processing.
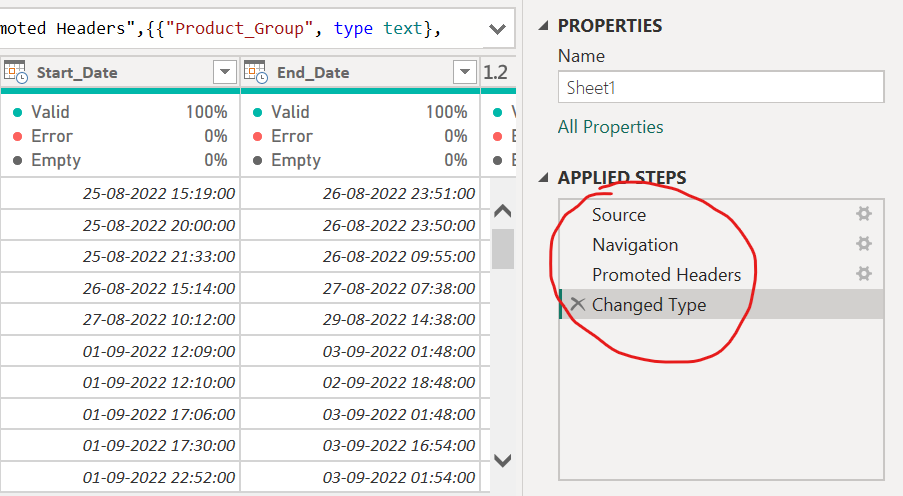 Screenshot of the Power Query Editor’s optimization steps show the outcomes of each stage when you pick it.
3.Effective Visualization Techniques
Visualizations are the face of your reports, and optimizing them is crucial for a responsive user experience:
- Limit Visual Elements:
Avoid cluttering your report with too many visuals. Each visual adds to the load time, so prioritize key insights and remove non-essential elements.
- Aggregations in Visuals:
Aggregate data within visuals instead of relying on Power BI to aggregate large datasets, significantly improving rendering speed.
- Optimize Maps:
If using maps, limit the number of data points displayed, and consider using aggregated data for better performance.
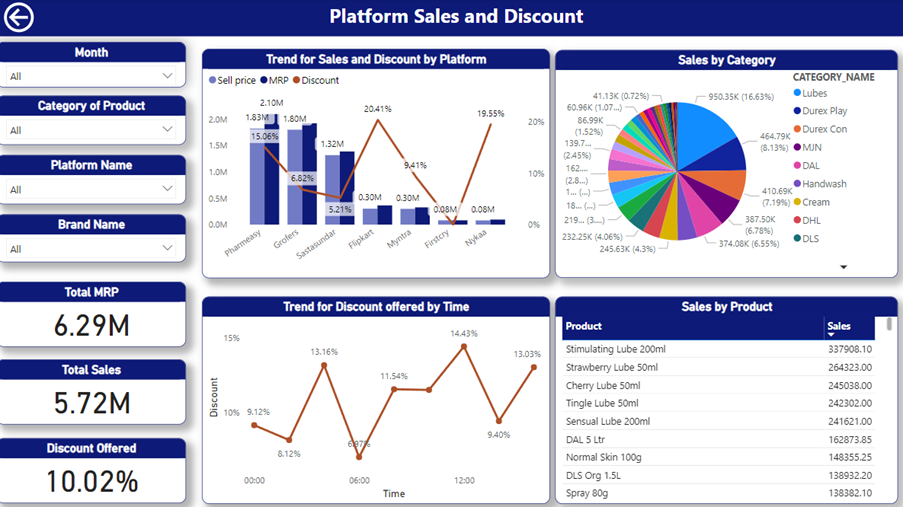
Sales Dashboard using optimized visualizations.
4.Monitor and Optimize DAX Calculations
DAX calculations can be resource-intensive, impacting report performance. Optimize DAX with the following tips:
- Measure Dependencies:
Review dependencies of your measures and ensure they are calculated only when needed. Avoid unnecessary recalculations.
- Optimize Time-Intensive Calculations:
Identify and optimize time-consuming DAX calculations, especially those involving large datasets or complex logic.
5.Maintain Security and Governance
Implementing proper security and governance measures contributes to a secure and well-maintained Power BI environment:
- Role-Level Security (RLS):
Utilize RLS to restrict data access based on user roles, ensuring each user sees only relevant data, thus improving query performance.
- Regular Review and Clean Up:
Regularly review and clean up your Power BI workspace. Remove unnecessary datasets, reports, and dashboards to streamline the environment.
Conclusion
Optimizing Power BI performance is an ongoing process that involves efficient data modeling, optimized queries, effective visualization techniques, and careful monitoring of DAX calculations. By implementing these best practices, you can unlock the full potential of Power BI, providing users with fast, responsive, and impactful reports and dashboards. A well-optimized Power BI environment is the key to turning data into insights that drive informed decision-making.
For further updates, get in touch with us.
Ready to get started?
From global engineering and IT departments to solo data analysts, DataTheta has solutions for every team.