
- Home
- /
- Case Study
- /
- ML Demand Forecasting for Smarter Pharmaceutical Supply Planning
ML Demand Forecasting for Smarter Pharmaceutical Supply Planning
- Pharmaceuticals
- Demand Forecasting
- Machine Learning
- MLOps

Project Snapshot
Client
Regional Pharmaceutical Manufacturer and Distributor
Location
India and Southeast Asia
Industry
Pharmaceutical Manufacturing and Healthcare Distribution
Services
- Data Science and Machine Learning
- Demand Forecasting and Inventory Analytics
- MLOps and Model Monitoring
Turning Volatile Demand Into Reliable Supply Decisions
A pharmaceutical company supplied prescription medicines, over-the-counter products, and hospital essentials through plants, regional depots, distributors, and institutional channels.
Planning teams relied on spreadsheets and historical averages, even as demand shifted with seasonal illness, tenders, launches, supply disruptions, and regional disease patterns.
DataTheta developed a production-grade forecasting platform that generated product-location forecasts, explained key demand drivers, and placed recommendations directly inside the planning workflow.
This case study presents an illustrative composite scenario and representative project outcomes.
The Challenge
The company managed thousands of product-location combinations with very different demand patterns. A national forecast could look accurate while hiding shortages in one region and excess stock in another.
Planners created separate forecasts using sales history, field inputs, and judgement. The process worked during stable periods but responded poorly to sudden changes.
The Main Challenges Included
- Sales, inventory, tender, promotion, and distributor data stored separately.
- Spreadsheet forecasts based mainly on recent averages and manual adjustments.
- Limited visibility into regional seasonality and channel-specific demand.
- Excess inventory for slower products alongside shortages of essential medicines.
- Forecast overrides applied without consistent reasons or performance tracking.
- New products lack enough history for traditional forecasting.
- Models updated irregularly after market conditions changed.
- No shared method for measuring forecast quality by product and location.
The business did not need one impressive accuracy score. It needed dependable forecasts at the level where supply, replenishment, and production decisions were made.
The Solution
DataTheta designed a machine-learning platform combining historical demand with commercial, inventory, tender, calendar, and regional signals.
The solution generated forecasts by product, location, channel, and planning horizon. Prediction intervals showed where confidence was strong and where planner judgement was required.
The Forecasting Workflow
- Collect sales orders, shipments, returns, inventory movements, and lost-sales signals.
- Add tender schedules, promotions, holidays, launches, and supply constraints.
- Standardise product, channel, customer, and location identifiers.
- Separate genuine demand from fulfilment limits and temporary stock shortages.
- Select forecasting methods based on each product’s demand behaviour.
- Produce weekly and monthly forecasts with confidence ranges.
- Compare model recommendations with planner overrides and approved plans.
- Feed final forecasts into replenishment and production-planning systems.
- Track error, bias, service levels, stockouts, and inventory outcomes.
A single algorithm was not forced across the portfolio. Stable, seasonal, intermittent, and new products followed different modelling strategies.
Planners reviewed the forecast, confidence range, and strongest demand drivers before accepting or changing it.
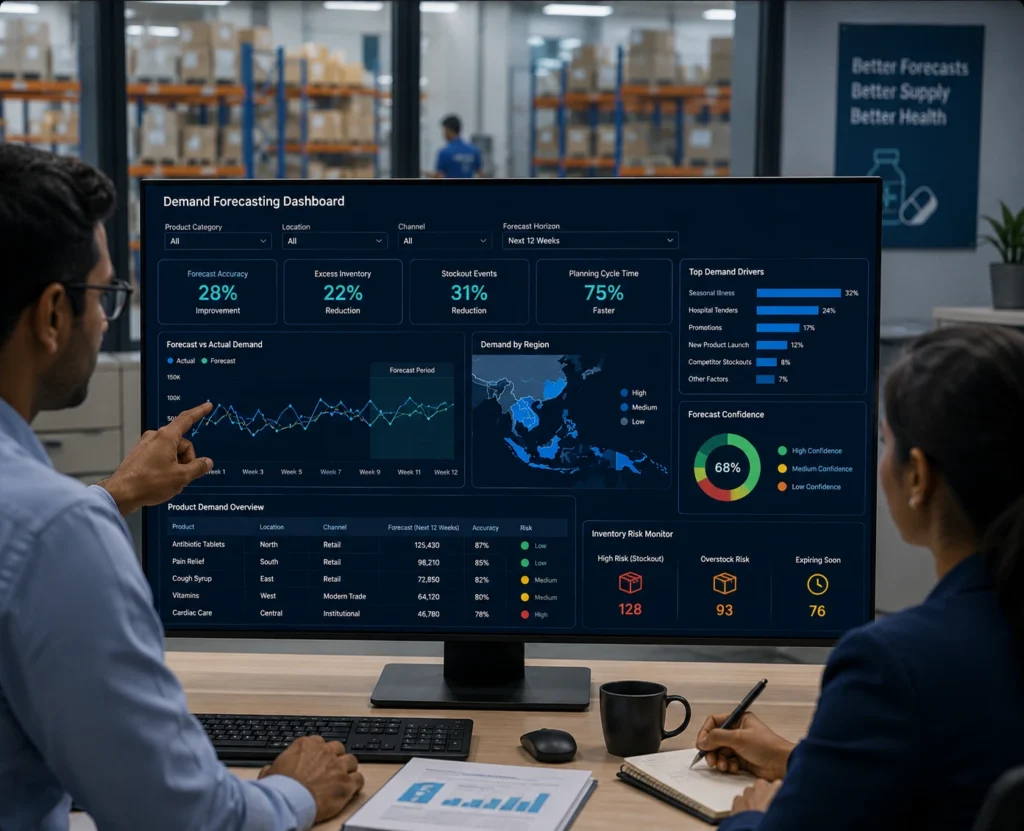
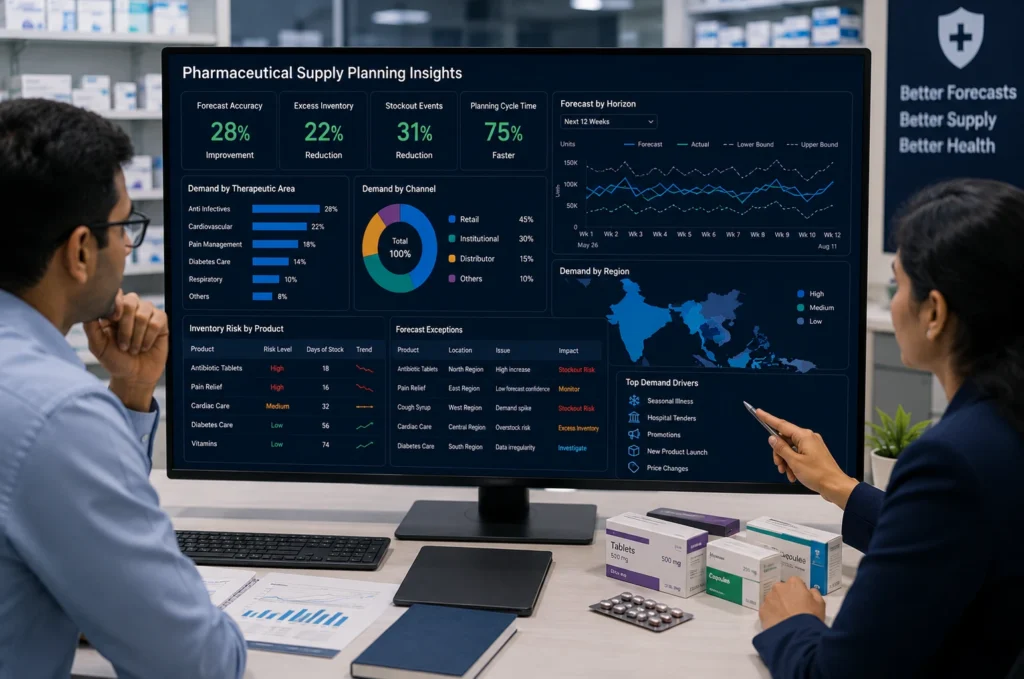
28%
Higher Forecast Accuracy
22%
Lower Excess Inventory
31%
Fewer Stockout Events
75%
Faster Planning Cycles
Data and Model Design
Shipment history alone could not represent demand because low sales sometimes reflected unavailable stock rather than weak customer need.
Stockouts, back orders, returns, tender spikes, and one-time events were identified before training.
The Model Framework Included
- Time-series models for stable and seasonal products.
- Machine-learning models for products influenced by several external factors.
- Intermittent-demand methods for slow-moving and specialist medicines.
- Hierarchical forecasting across national, regional, depot, and product levels.
- Similar-product methods for launches with limited history.
- Ensemble selection based on historical back-testing.
- Prediction intervals to avoid false precision.
- Explainability showing the main reasons behind forecast changes.
Rolling historical tests reproduced real planning cycles. Measurement covered error, bias, service levels, inventory, and expiry risk.
Planner Workflow and Human Judgement
The platform was embedded into the existing planning process rather than delivered as a separate dashboard.
Planners received exception-based worklists highlighting large demand changes, weak confidence, unusual overrides, and potential inventory risks.
Each manual override required a reason, such as a hospital tender, competitor shortage, promotion, regulatory change, or local outbreak. The system measured whether overrides improved the final forecast.
This linked statistical prediction with commercial knowledge while directing human attention to high-impact exceptions.
MLOps and Governance
Forecasting performance could decline as disease patterns, customer behaviour, channels, and product portfolios changed. Monitoring and retraining were therefore built into production.
Core MLOps Controls
- Version control for data, features, models, and forecast configurations.
- Automated validation for missing, delayed, duplicated, or abnormal inputs.
- Monitoring for forecast error, bias, feature drift, and model drift.
- Performance dashboards by product, location, channel, and model version.
- Retraining triggers when accuracy crossed agreed thresholds.
- Champion-challenger testing before replacing a production model.
- Approval workflows for major model or business-rule changes.
- Lineage from every forecast to its data and model version.
Supply planning owned the final forecast, commercial teams owned market inputs, and data science owned model performance.
Automation expanded only when model quality, planner adoption, and supply outcomes improved together.
Implementation Approach
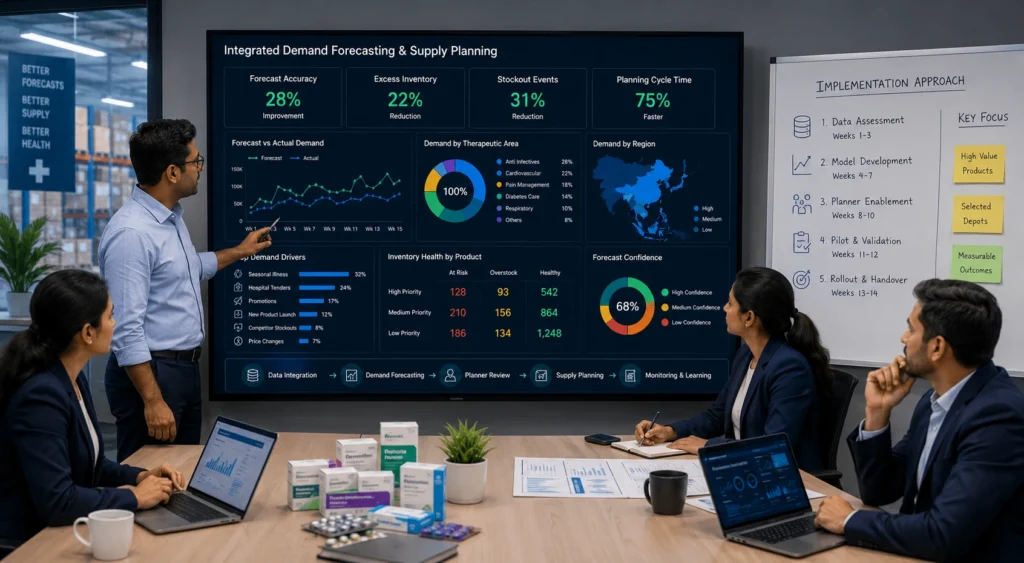
The programme followed a controlled 14-week plan focused on high-value products across selected depots and channels.
Delivery Stages
- Weeks 1–3: Data assessment, demand segmentation, and baseline measurement.
- Weeks 4–7: Feature engineering, model development, and back-testing.
- Weeks 8–10: Planner workspace, override workflow, and integration.
- Weeks 11–12: Controlled pilot with supply and commercial teams.
- Weeks 13–14: Monitoring, training, rollout, and operating handover.
Planners helped identify tender effects, substitution, channel loading, and constraints not visible in raw history.
The Impact
Forecast preparation became faster and more consistent. Planners no longer spent most of the cycle collecting spreadsheets and rebuilding product-level calculations.
Forecast accuracy improved by 28%. Excess inventory fell by 22%, while stockout events decreased by 31%.
Business Outcomes
- Better medicine availability across priority regions and customer channels.
- Lower working capital tied up in slow-moving inventory.
- Reduced expiry exposure for short-shelf-life products.
- Faster responses to tenders, launches, and seasonal changes.
- More consistent production and replenishment planning.
- Clear measurement of whether planner overrides added value.
- Earlier detection of forecast bias and demand shifts.
- A reusable ML platform for further supply-chain decisions.
Value came from connecting prediction to replenishment, production, inventory, and human decisions.
Supply reviews became exception-led rather than spreadsheet-led. Teams focused on products requiring action instead of reconciling several competing forecasts.
Future Opportunities
- Dynamic safety-stock recommendations by product and location.
- Production-sequencing optimisation based on demand and capacity.
- Distributor replenishment recommendations.
- Expiry-risk prediction and inventory rebalancing.
- Tender win-probability and volume forecasting.
- Scenario modelling for disruptions and regulatory changes.
- Supplier-risk forecasting for critical raw materials.
- Prescriptive allocation during constrained supply.
Conclusion
Machine learning created value only when forecasts became reliable, explainable, monitored, and embedded in supply decisions.
By combining segmented forecasting, planner judgement, production integration, and MLOps, the company improved availability while reducing inventory pressure and manual planning effort.
“DataTheta helped us turn demand forecasting from a spreadsheet exercise into a continuously learning supply-planning capability.”
Related Case Studies

When the Data Can’t Be Trusted, Neither Can the Model
14-day advance failure prediction
- AI-Ready Data
- Data Governance
- Manufacturing Analytics

Car Rental Fleet Optimization
14-day advance failure prediction
- Fleet Optimization
- Demand Forecasting
- Dynamic Pricing

The Specialist a Stalled Project Needed – In Two Weeks, Not Two Quarters
14-day advance failure prediction
- Specialist Talent Augmentation
- Apache Kafka
- Real-Time Analytics