


Introduction
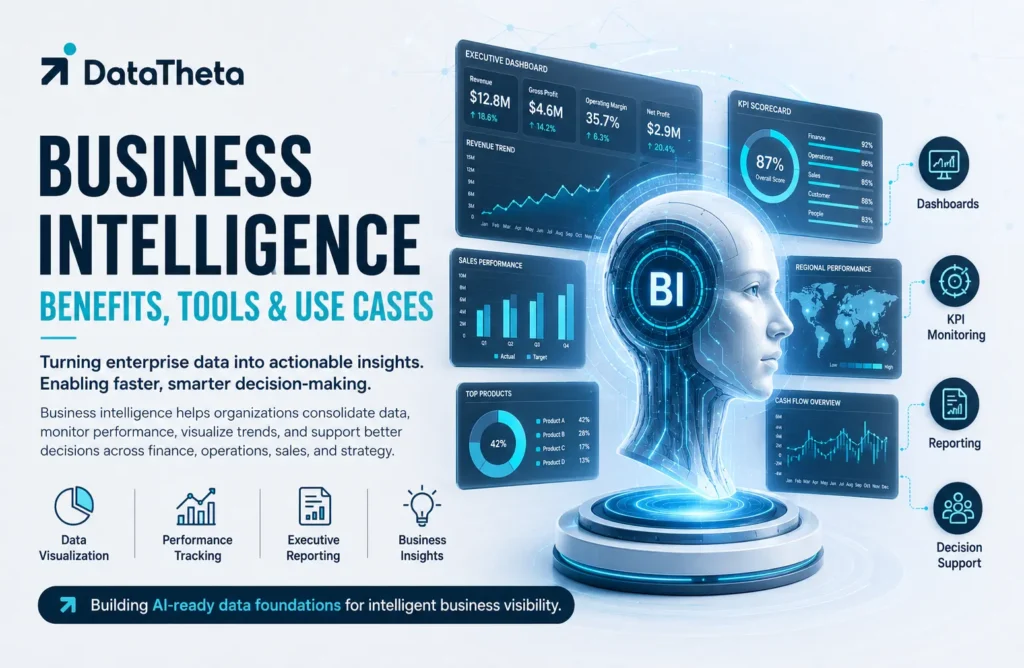
Business intelligence is the process of collecting, organising, analysing, and presenting business data to support informed decisions. It transforms information from finance, sales, marketing, operations, customer service, and other systems into dashboards, reports, and performance insights. Organisations use business intelligence to monitor key metrics, identify trends, compare results, improve planning, and respond quickly to changing conditions. Its effectiveness depends on reliable data, standardised definitions, suitable technology, governance, and user adoption. This article explains what business intelligence is, how it works, its core components, major tools, practical use cases, benefits, implementation challenges, best practices, and future importance across modern data-driven organisations and industries worldwide today in a competitive digital business environment.
1. What Is Business Intelligence?
Business intelligence, commonly abbreviated as BI, is the process of converting organisational data into meaningful information that supports business decisions. It combines data integration, storage, analysis, reporting, and visualisation to help users understand performance and identify opportunities or problems.
BI systems gather information from applications such as customer relationship management, enterprise resource planning, finance, sales, marketing, inventory, and human resources platforms. The data is then organised and presented through reports, dashboards, scorecards, and analytical views.
Business intelligence primarily helps organisations understand what has happened and what is currently happening. More advanced BI platforms may also include forecasting, artificial intelligence, natural-language queries, and automated recommendations.
1.1) Key Characteristics of Business Intelligence
- Combines data from multiple business applications and departments.
- Presents information through dashboards, reports, and visualisations.
- Tracks key performance indicators and operational metrics.
- Supports strategic, tactical, and operational decisions.
- Provides consistent definitions for important business measures.
- Enables users to examine trends and performance changes.
- Makes organisational data more accessible to authorised users.
2. How Does Business Intelligence Work?
Business intelligence follows a structured process that moves data from operational systems to reports and dashboards. Each stage must be reliable because inaccurate source information can produce misleading insights.
2.1) Data Collection
BI platforms collect information from sources such as:
- Enterprise resource planning systems
- Customer relationship management platforms
- Financial and accounting applications
- E-commerce and point-of-sale systems
- Supply chain and inventory platforms
- Websites and digital applications
- Spreadsheets and external databases
The required sources depend on the questions and performance measures the organisation wants to examine.
2.2) Data Integration and Preparation
Information from different systems may use inconsistent formats, identifiers, calculations, and definitions. Integration processes combine these sources and prepare them for analysis.
Common preparation activities include removing duplicates, correcting invalid values, standardising formats, matching related records, and calculating business measures.
2.3) Data Storage and Modelling
Prepared information is commonly stored in a data warehouse, data mart, lakehouse, or cloud analytics platform. Data models organise the information into structures that are easier to query and understand.
A semantic layer may provide shared definitions for metrics such as revenue, profit, customer count, inventory, and conversion rate.
2.4) Reporting and Visualisation
BI tools present information through charts, dashboards, scorecards, tables, and automated reports. Users can filter results, compare periods, examine specific regions, and investigate performance changes.
2.5) Decision-Making and Monitoring
Business users interpret BI outputs and use them to take action. Dashboards may also provide alerts when performance exceeds or falls below defined thresholds.
3. Core Components of Business Intelligence
A complete BI environment combines data, technology, governance, analytical processes, and user-facing tools.
3.1) Data Sources
Data sources are the applications, databases, files, and services that generate business information. Their accuracy and consistency directly affect BI reliability.
3.2) ETL and ELT Pipelines
ETL and ELT processes extract information from source systems, transform it into a usable format, and load it into an analytical platform.
Automated pipelines ensure that dashboards and reports receive updated information according to defined schedules.
3.3) Data Warehouses and Data Marts
A data warehouse provides centralised information for enterprise reporting and analysis. A data mart contains data focused on a specific department, subject, or business function.
3.4) Data Models and Semantic Layers
Data models define how business information is structured and related. Semantic layers translate complex technical structures into understandable business terms and measures.
3.5) Dashboards and Reports
Dashboards provide visual summaries of important metrics, while reports offer structured and detailed information for recurring business requirements.
3.6) Data Governance and Security
Governance establishes ownership, definitions, quality rules, access permissions, and usage policies. Security controls ensure that users can view only the information relevant to their responsibilities.
4. Major Types of Business Intelligence
Different BI approaches support different users, business needs, and decision-making requirements.
4.1) Traditional Business Intelligence
Traditional BI relies on centrally managed reports created by technical or specialist teams. It provides strong control and consistency but may require more time to address new reporting requests.
4.2) Self-Service Business Intelligence
Self-service BI allows authorised business users to explore data, create visualisations, and develop reports without depending entirely on technical teams.
Governance remains essential to prevent inconsistent calculations and uncontrolled data access.
4.3) Real-Time Business Intelligence
Real-time BI processes and displays information shortly after events occur. It is useful for fraud monitoring, logistics, manufacturing operations, customer service, and digital transactions.
4.4) Embedded Business Intelligence
Embedded BI integrates reports and analytical capabilities directly into business applications. Users can access relevant insights without moving to a separate reporting platform.
4.5) Mobile Business Intelligence
Mobile BI allows users to access dashboards and reports through smartphones and tablets. It helps executives, field teams, and remote employees monitor performance from different locations.
5. Popular Business Intelligence Tools
BI tools help organisations connect data, create visualisations, distribute reports, and support interactive analysis.
5.1) Microsoft Power BI
Microsoft Power BI supports data modelling, interactive dashboards, self-service analysis, and integration with Microsoft applications and cloud services.
5.2) Tableau
Tableau is widely used for interactive visualisation, data exploration, and dashboard development. It helps users analyse information through flexible visual interfaces.
5.3) Qlik Sense
Qlik Sense provides self-service analytics, associative data exploration, dashboards, and reporting. Its analytical engine helps users investigate relationships across data.
5.4) Looker
Looker supports governed data modelling, cloud-based analytics, embedded reporting, and shared business metrics. It is commonly used with modern cloud data platforms.
5.5) SAP Analytics Cloud
SAP Analytics Cloud combines business intelligence, planning, forecasting, and analytical capabilities, particularly for organisations using SAP business systems.
5.6) IBM Cognos Analytics
IBM Cognos Analytics supports enterprise reporting, dashboards, data exploration, and governed analytical workflows.
Tool selection should consider data sources, user skills, scalability, security, deployment model, integration needs, governance, and total cost.
6. Major Business Intelligence Use Cases
Business intelligence supports performance management and decision-making across organisational functions.
6.1) Executive Performance Monitoring
Executives use BI dashboards to monitor revenue, profitability, customer growth, operational efficiency, and strategic objectives. Consolidated views help leaders identify where performance requires attention.
6.2) Sales Analysis
Sales teams analyse revenue, conversion rates, pipelines, account activity, product demand, and regional results. These insights support target setting, forecasting, and opportunity management.
6.3) Financial Reporting
Finance departments use BI for budgeting, profitability analysis, cash-flow monitoring, expense management, variance analysis, and management reporting.
6.4) Customer Analytics
BI combines information from sales, service, marketing, and digital channels to examine customer behaviour, satisfaction, retention, and purchasing patterns.
6.5) Supply Chain and Inventory Management
Supply chain teams monitor inventory levels, supplier performance, delivery times, warehouse activity, and order fulfilment. BI helps identify shortages, delays, and excess stock.
6.6) Marketing Performance
Marketing teams use BI to track campaign reach, engagement, conversions, acquisition costs, and return on investment. These insights help improve targeting and budget allocation.
6.7) Workforce and Operational Analytics
Human resources and operations teams use BI to monitor staffing, productivity, process performance, quality, absenteeism, resource utilisation, and service levels.
7. Top 7 Benefits of Business Intelligence
Business intelligence creates value by making trusted information accessible and understandable.
7.1) Better Decision-Making
BI gives decision-makers timely evidence for evaluating performance, comparing options, and selecting appropriate actions.
7.2) Improved Data Visibility
Dashboards provide a consolidated view of information across departments, systems, locations, and business processes.
7.3) Consistent Business Metrics
Governed data models establish common calculations for measures such as revenue, margin, customer count, and inventory. This reduces conflicting reports.
7.4) Faster Reporting
Automated pipelines and dashboards reduce manual spreadsheet consolidation and recurring report preparation.
7.5) Greater Operational Efficiency
BI helps identify bottlenecks, delays, waste, underused resources, and process variations. Teams can use these insights to improve operations.
7.6) Stronger Performance Management
Organisations can compare actual results with targets, budgets, benchmarks, and previous periods. This improves accountability and performance tracking.
7.7) Earlier Identification of Risks and Opportunities
BI highlights unusual trends, declining performance, customer changes, and emerging opportunities before they become more significant.
8. Challenges and Business Intelligence Best Practices
BI initiatives may fail when organisations focus on dashboards without addressing data quality, ownership, governance, and user needs.
8.1) Common Business Intelligence Challenges
- Incomplete, inaccurate, or outdated source information
- Conflicting definitions of business metrics
- Data distributed across disconnected applications
- Excessive numbers of reports and dashboards
- Limited adoption among business users
- Poor dashboard design and unclear visualisations
- Security and privacy concerns
- Slow performance with large datasets
- Dependence on manual spreadsheet processes
- Weak alignment with business objectives
8.2) Business Intelligence Best Practices
- Begin with clear business questions and user requirements.
- Define standard metrics and calculation methods.
- Establish ownership for important data and reports.
- Automate integration and data-quality checks.
- Design dashboards for specific roles and decisions.
- Limit visualisations to relevant and actionable information.
- Apply appropriate security and access controls.
- Train users to interpret reports correctly.
- Monitor report usage, accuracy, and performance.
- Remove outdated, duplicated, or unused dashboards.
9. Business Intelligence, Data Analytics, and Reporting
Business intelligence, data analytics, and reporting are related but have different scopes.
9.1) Role of Each Discipline
Business intelligence provides an organised environment for accessing standardised data, dashboards, reports, and performance measures.
Data analytics applies techniques to investigate patterns, explain outcomes, predict future results, and recommend actions.
Reporting presents information in a structured format, often for recurring operational, management, or regulatory requirements.
9.2) Main Differences
- BI provides governed access to business information.
- Analytics investigates patterns and produces deeper insights.
- Reporting presents recurring and structured information.
- BI commonly combines dashboards, models, and reports.
- Analytics may use statistical and predictive methods.
- Reporting usually answers predefined questions.
- BI can support both regular monitoring and interactive analysis.
10. Future of Business Intelligence
Business intelligence is becoming more automated, conversational, real-time, and closely integrated with everyday workflows.
10.1) AI-Assisted Business Intelligence
AI can help users generate queries, identify trends, summarise dashboards, explain performance changes, and create visualisations through natural-language instructions.
10.2) Conversational Analytics
Users will increasingly ask business questions in ordinary language and receive relevant metrics, explanations, and visual responses without manually building complex queries.
10.3) Real-Time and Predictive Insights
BI platforms will combine current operational data with forecasting models. This will help organisations move from historical reporting towards proactive decision-making.
10.4) Embedded and Mobile Analytics
Analytical capabilities will become more deeply integrated into applications, workflows, and mobile environments, allowing users to access insights at the point of decision.
10.5) Stronger Governance and Data Literacy
As self-service analytics expands, organisations will require stronger governance, shared definitions, metadata, security, and user education to maintain trustworthy reporting.
Conclusion
Business intelligence transforms organisational data into dashboards, reports, and insights that support informed decisions. It combines data integration, storage, modelling, visualisation, governance, and reporting to provide a consistent view of business performance. Organisations use BI for executive monitoring, sales analysis, financial reporting, customer analytics, marketing, supply chains, and operations. Its benefits include better decisions, improved visibility, consistent metrics, faster reporting, greater efficiency, stronger performance management, and earlier identification of risks and opportunities. Successful BI adoption requires reliable data, clear objectives, effective governance, suitable tools, and user-friendly dashboards. Businesses that embed trusted intelligence into everyday workflows can improve accountability, respond faster, and manage performance more effectively.